
In the world of search and discovery, the numbers don’t lie. If you’re working on SEO — whether you’re optimising your own website, helping clients, or building up your brand presence — tracking the right metrics is how you turn guesswork into strategy. These metrics aren’t static checkpoints; they form a dashboard of insight that lets you lean into what’s working and course-correct where you’re not. Below, we walk through the 13 SEO metrics you should be watching closely — and what each one reveals about your path forward.
13 SEO Metrics to Track If You Want Visible Results
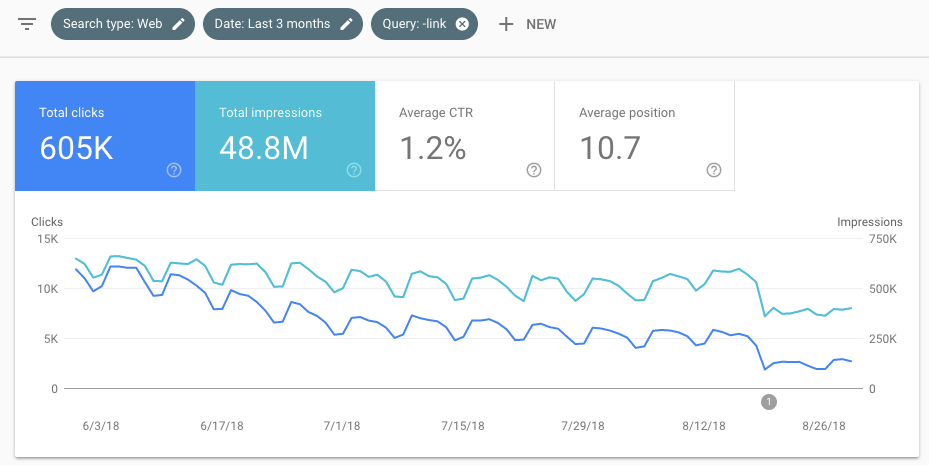
Total Clicks
Think of this as your scoreboard. When a user types a query and your page shows up, how often do they actually click? Rising click counts signal that your content is being seen and acted upon. If impressions are climbing but clicks remain flat or drop, the signal is: your snippet, title or meta description may not be pulling its weight. You’ll want to dive into those listings and ask whether the promise you’re making in the result aligns with what the user expects once they land.
The number of clicks your site receives from search engine results (for example via Google Search Console).
Clicks = real traffic coming in; a rise means more users are choosing your listing.
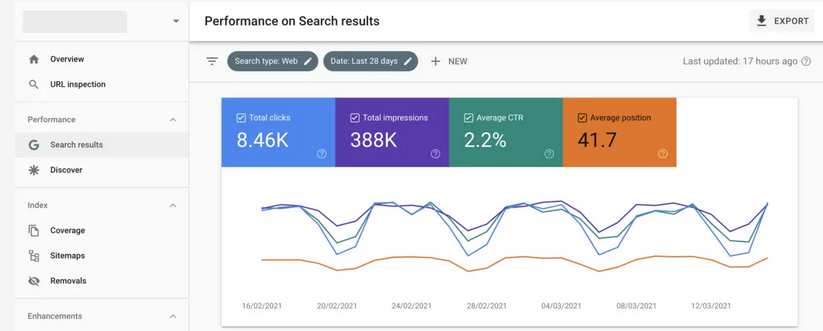
If clicks are stagnant while impressions rise, your title/description might need work. If clicks drop, check for algorithm or technical issues.
Core Web Vitals
Good user experience is now baked into search outcomes. The combination of visual stability (CLS), loading speed (LCP) and interactivity (FID) shapes whether users trust your site and whether search engines reward it. If your pages load slowly, shift unpredictably, or don’t respond quickly, you’re not just sacrificing usability — you’re affecting your search visibility. This means keeping an eye on these vitals over time, especially when making changes to design or infrastructure.

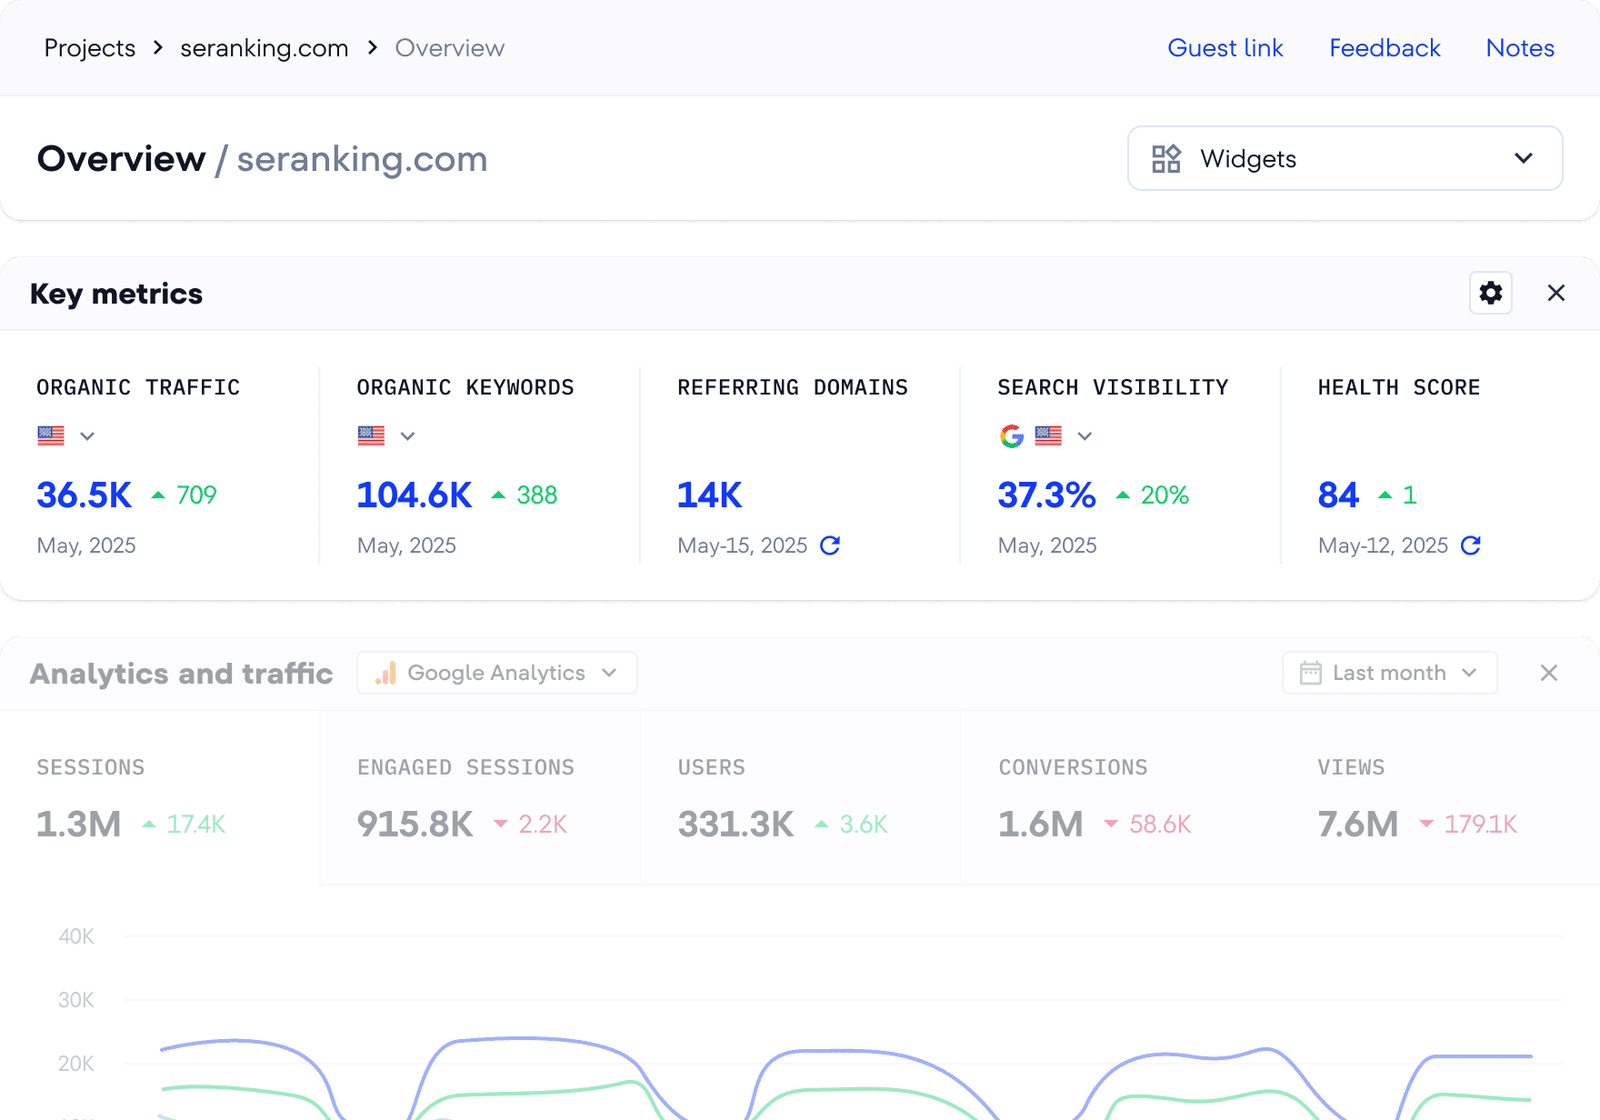
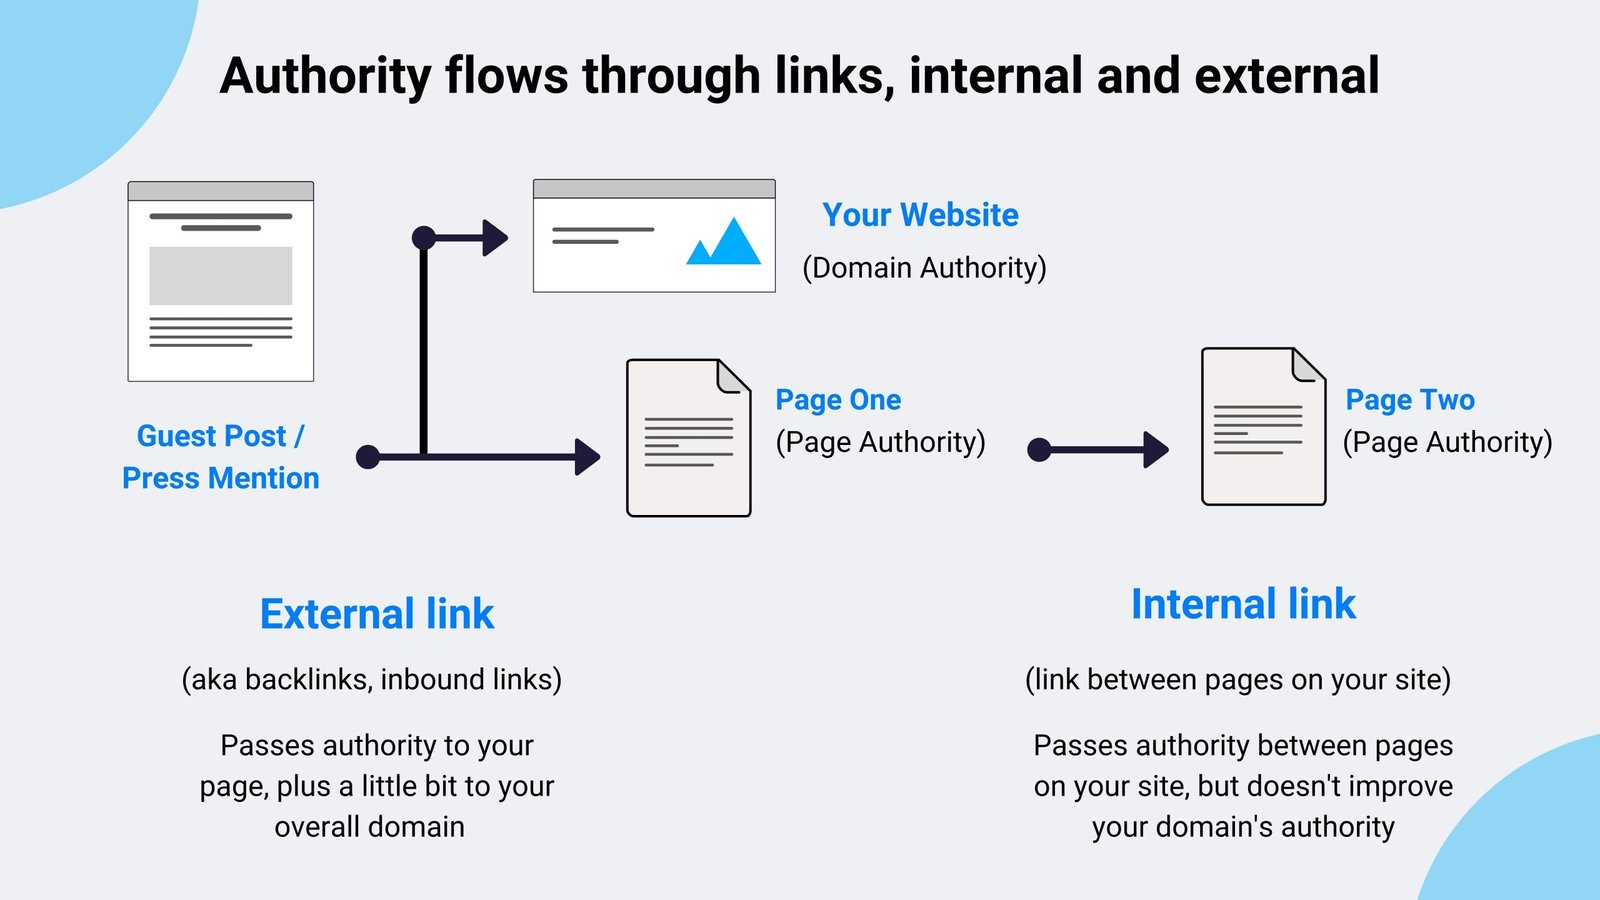
Referring Domains

The web still runs on connections: when quality websites link to you, they pass authority, trust and relevance signals. But it’s less about simply piling up links and more about gaining links from different domains (referring domains) that carry topical relevance and credibility. When you see a growing number of strong referring domains, you’re broadening your reach and reinforcing that your site is worthy of attention. If instead the domain-count stagnates, it may mean your content or outreach strategy needs to be refreshed.
Organic Traffic
Traffic is the raw material of growth. Organic sessions from search reflect what you’ve built so far: a combination of content relevance, technical optimisation and ranking. Watching the ebb and flow of organic traffic gives you a feel for whether your SEO campaigns are beginning to move the needle. But raw traffic alone isn’t enough — you’ll want to understand what kinds of traffic (which pages, which queries) are contributing, and whether they align with your business goals.

User Experience Metrics
Beyond traffic, how users behave on your site signals its true health. Metrics like average session duration, pages per session, bounce rate, and dwell time speak to whether users are satisfied once they arrive. A page might rank well and bring in traffic, but if visitors leave almost immediately, you’ve lost the value. Improving UX means aligning what users expect (based on query, snippet, title) with what they get — and making that experience easy, relevant and engaging.
Even if you drive traffic, if users leave instantly, you lose potential leads/conversions and search engines may interpret this as poor user experience.
Traffic Cost

Shows the “value” of your SEO efforts in monetary terms. use organic traffic value calculator helps you calculate the value of your organic traffic by estimating how much you would have had to spend on paid advertising to generate the same traffic.
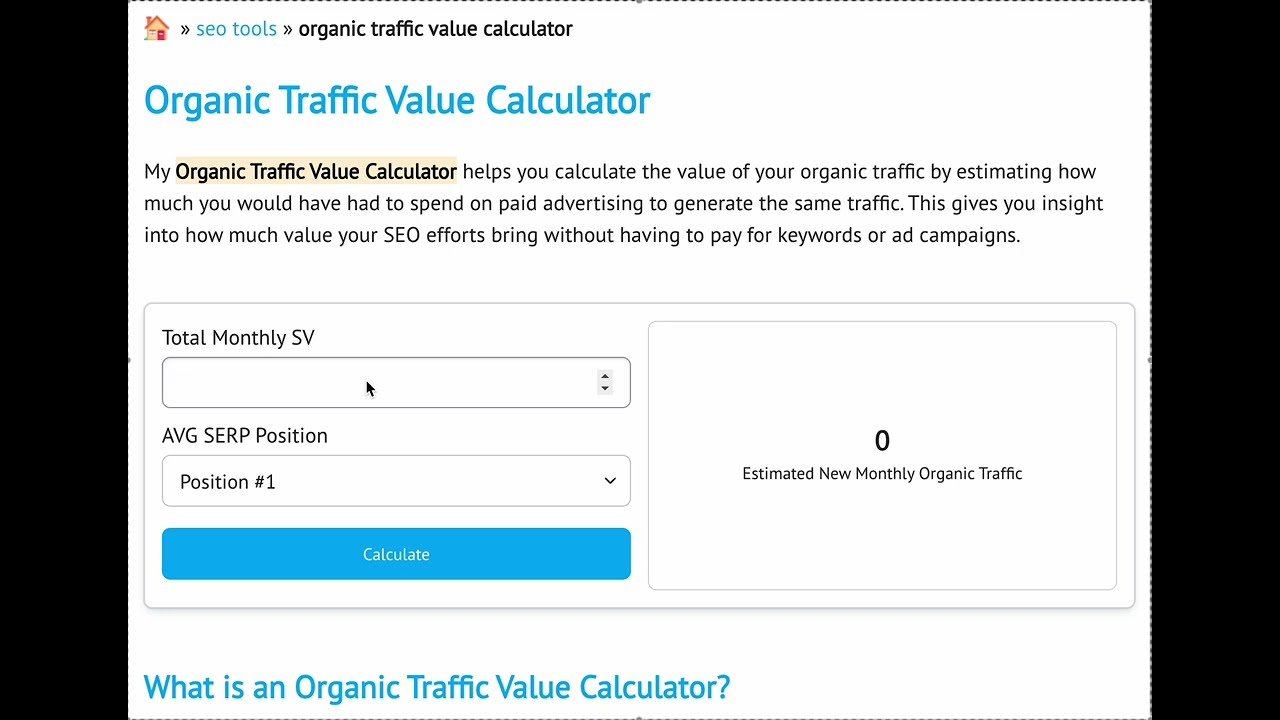
It’s one thing to measure visits — it’s another to attribute value. Traffic Cost is how you convert organic performance into a financial framework: if you were to buy the same visits via paid search, how much would that cost? This helps you frame SEO contributions in monetary terms, set budget priorities, and justify the effort. In a world where stakeholders want ROI, Traffic Cost becomes a valuable language.
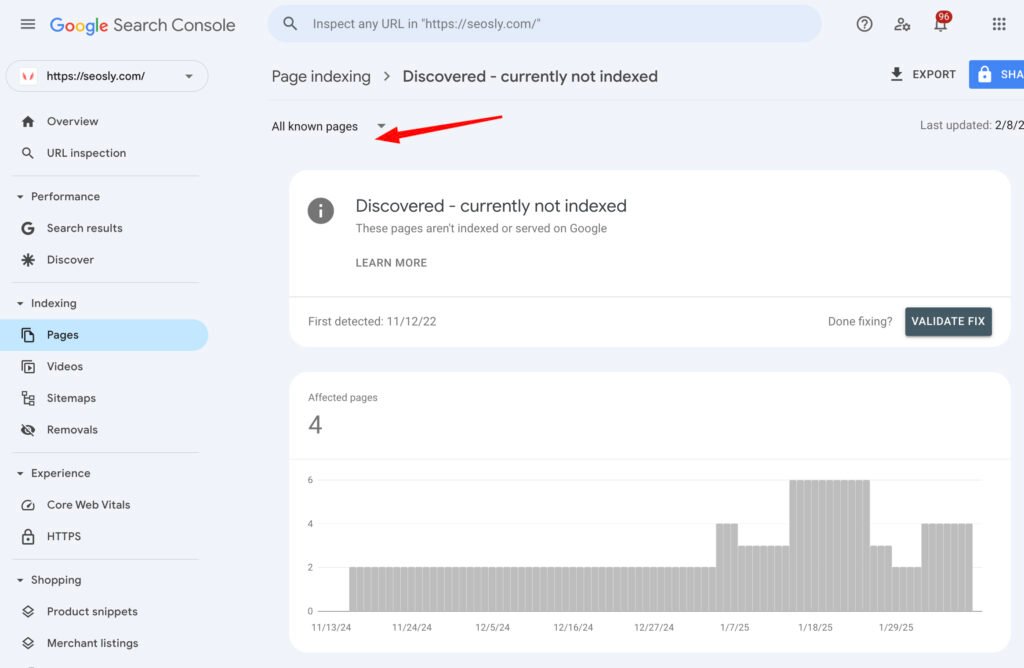
Indexed Pages
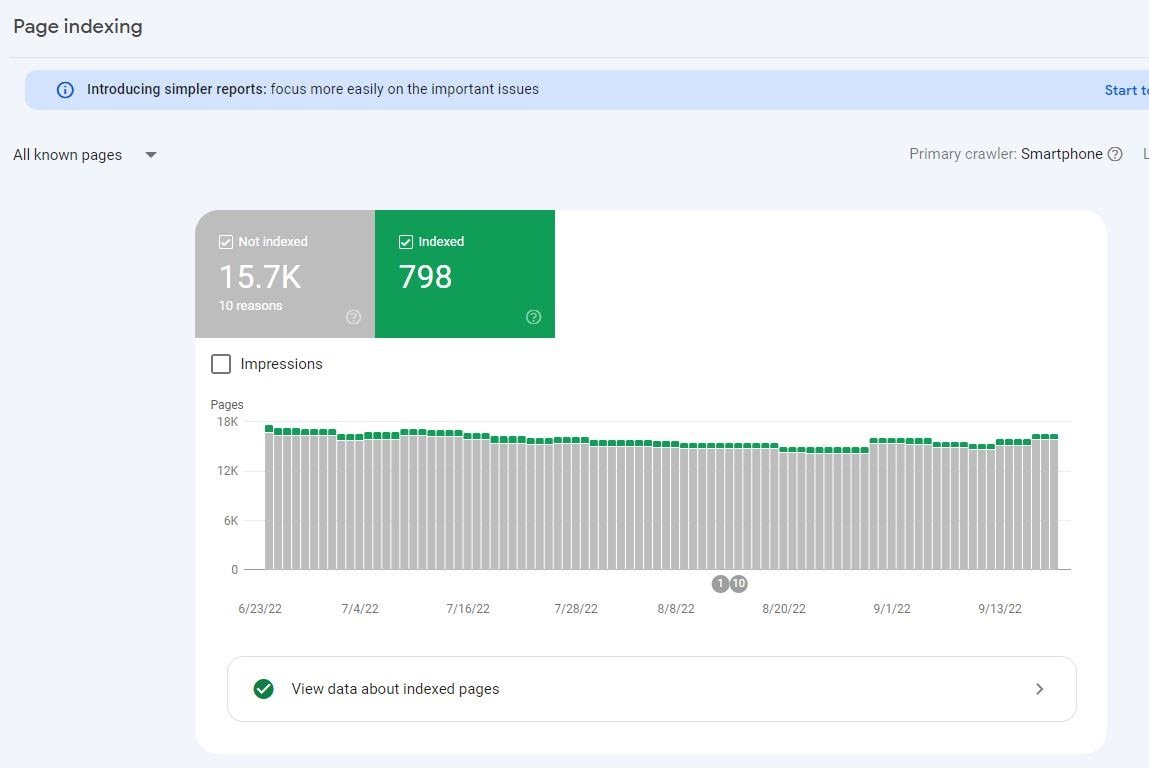
Visibility in search starts with candidacy: if your pages aren’t indexed, they won’t show up. Indexed Pages tells you how many of your discovered pages are eligible for ranking. If you notice many submitted pages or critical content not indexed, you’ll want to investigate sitemap issues, robots.txt blocks, canonical tags, no-index usage and crawl errors. Ensuring your “invested pages” are properly indexed maximises opportunities.
Use Search Console to check coverage. Fix pages flagged as “Excluded” or “Crawled – currently not indexed.” Ensure sitemap is submitted, no major technical blocks.
Average CTR
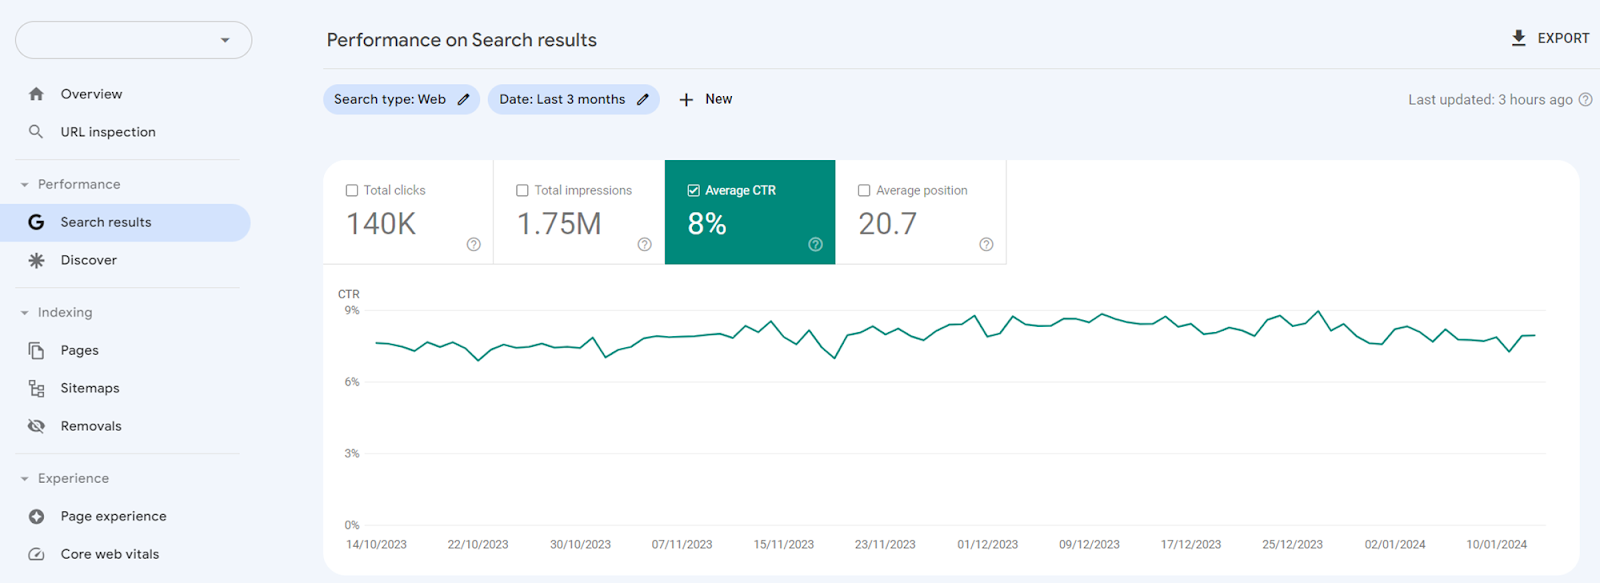
The percentage of users who click to your site after seeing it in search results is a barometer of how compelling you appear. If your CTR is low compared to peers or past performance, it sends a signal: your title or description may not align with what the searcher expects, or your position might be sub-optimal. It’s also a reminder that ranking is just one part; you must also earn the click.
Keyword Rankings
Higher rankings generally bring more traffic. They act as early indicators of visibility.
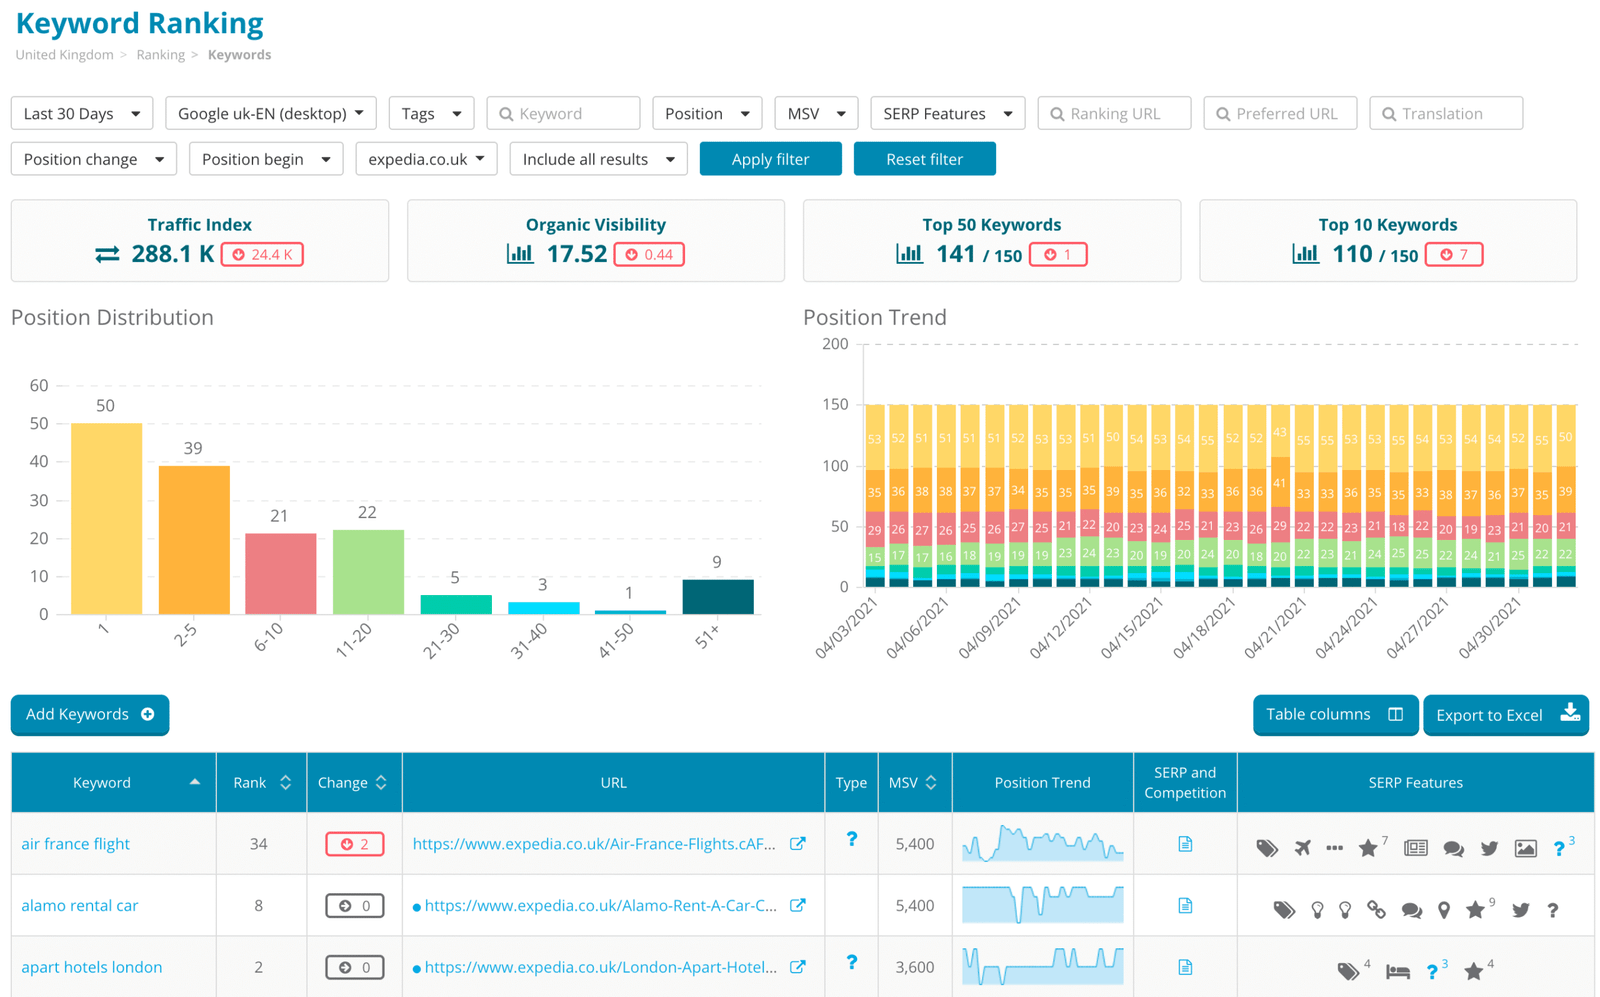
Even though traffic is the outcome we care about, tracking where your pages rank for target phrases remains essential. Keyword Rankings help you monitor the visibility you’re building and spot drops or gains. It’s a leading indicator: shifts here often precede changes in traffic. Watching rankings also helps you prioritise content refreshes or expansion into new terms.
Track keyword positions regularly. If rankings drop, look into recent content changes, algorithm updates, or competitor activity.
Coverage Errors
Technical leaks are invisible until they aren’t — and when they cascade, they undermine everything else. Coverage Errors (for example via Google Search Console) expose pages blocked from indexing, redirect loops, server errors, or no-index flags. If you ignore them, you risk traffic losses even when you’re doing everything else right. Regular reviews and fixes keep the foundation intact.

Putting the Story Together
Tracking each metric in isolation gives you moments of insight — but real clarity happens when you let them talk to each other. Imagine you see impressions rising, but clicks and CTR are flat: the issue lies in snippet/presentation, not content relevance. Or you have good traffic numbers but falling pages per session and high bounce — user experience is tripping you up. Maybe indexed pages are down while traffic is dipping: that’s a technical leak. Connecting the dots gives you direction.
Building Your Dashboard
For your team, a simple dashboard (e.g., in Google Data Studio or a BI tool) that surfaces these SEO metrics monthly (and drills weekly if you see anomalies) will serve you well. Choose your top 5 – 10 metrics based on the business stage you’re in (startup site vs mature site vs big brand). Set realistic benchmarks and review them with context (seasonality, content updates, algorithm shifts). For your ventures — whether the D2C brand in India or the SaaS consulting funnel you’re building — aligning metrics to revenue and growth goals is what transforms numbers into decisions.
Closing Thoughts
The SEO world keeps shifting — algorithms, user behaviour, devices — but some things endure: the need for visibility, engagement, trust and technical integrity. By watching the right SEO metrics, you give yourself the chance not just to react but to steer. These metrics don’t guarantee success, but they do give you the signals you need to align work with outcomes.