Original research and data-driven content are among the fastest ways to earn high-quality backlinks, build authority, and stand out in a saturated content landscape. When done well, a single research asset can attract links, social shares, and leads for years.
What Is Original Research Content?
Original research content is any asset where your brand generates new data or insights instead of simply summarizing existing sources. This can come from surveys, experiments, proprietary product data, interviews, or aggregated datasets.
Typical formats include:
- Benchmark reports, industry surveys, and trend studies.
- A/B test breakdowns, case studies, and experiments showcasing performance changes.
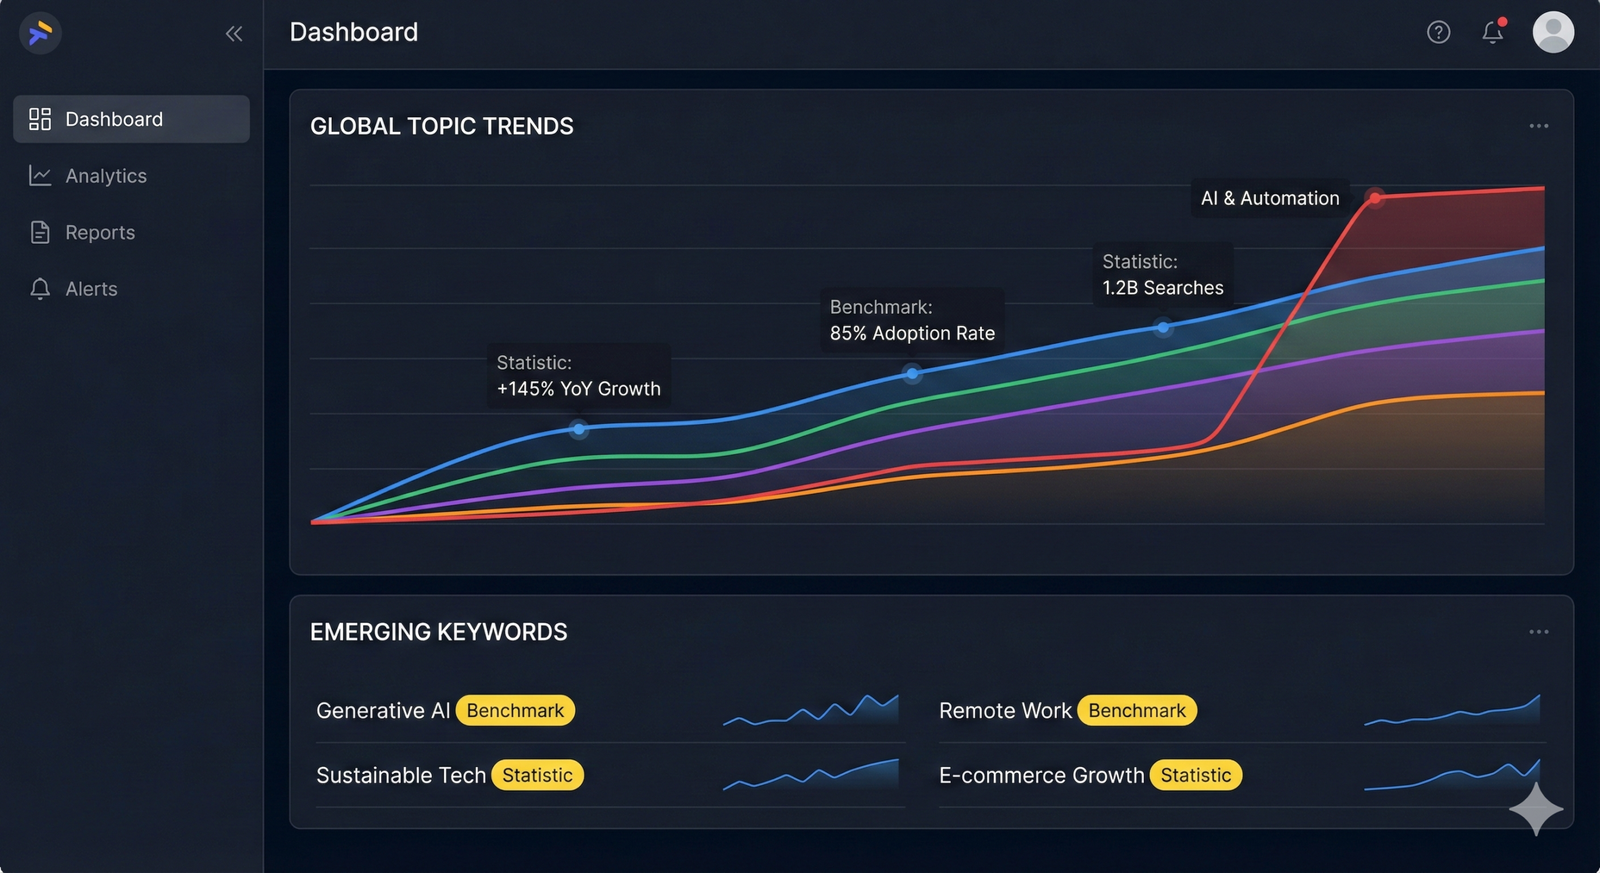
- Data visualizations like charts, graphs, and interactive dashboards.

Why Original Research Wins Links
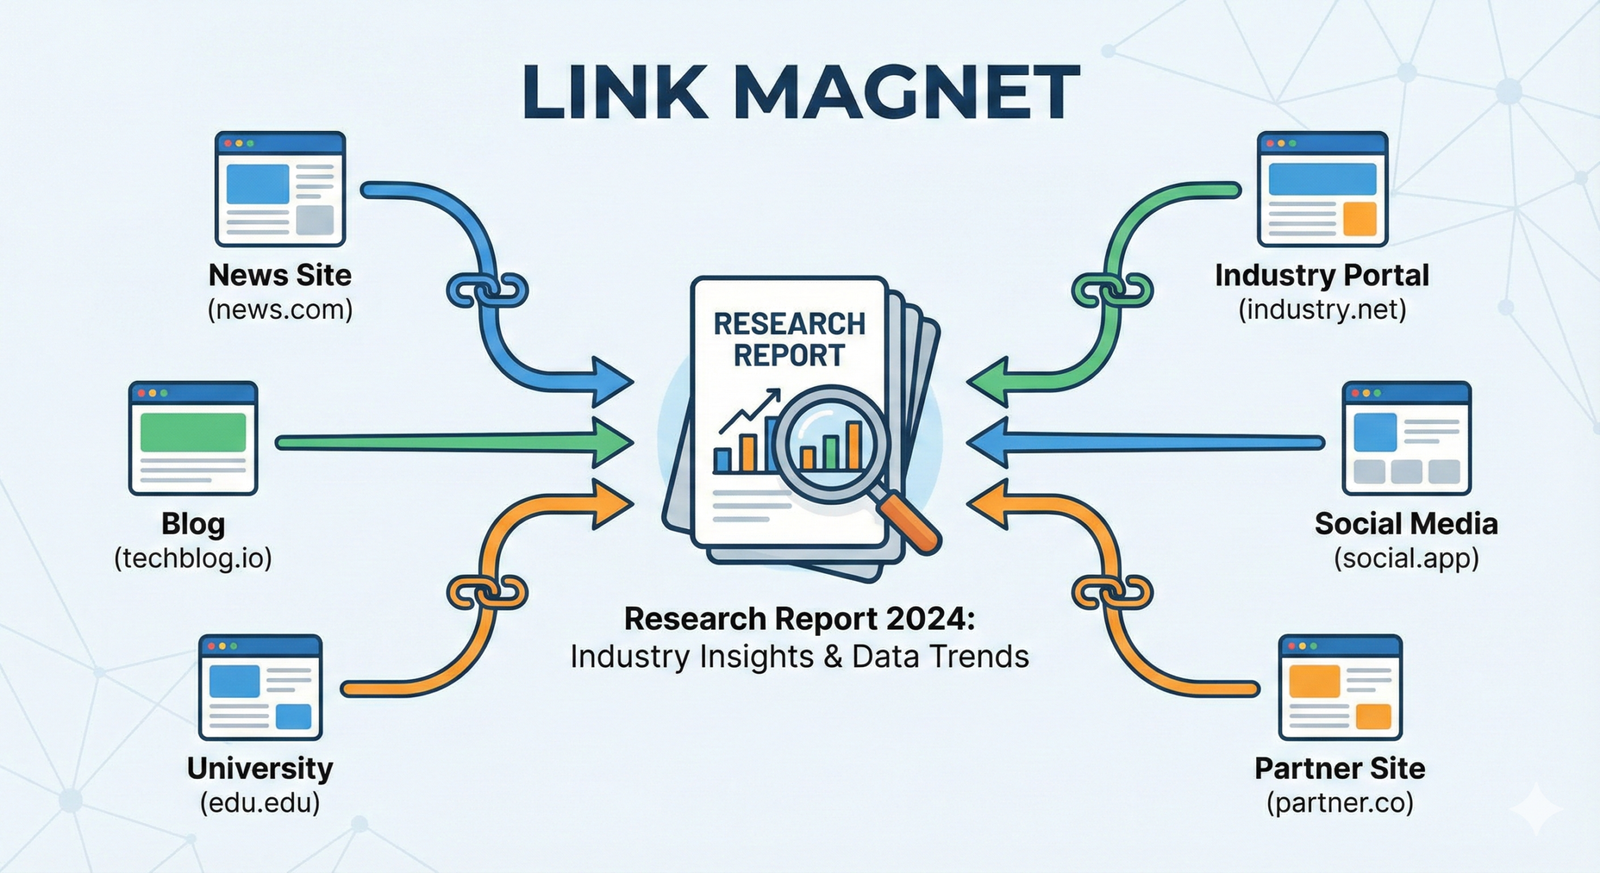
Original research works so well for link building because it gives other creators something new and quotable to reference. Journalists, bloggers, and influencers constantly need fresh stats, and they prefer to link to the original source rather than a generic roundup.
Key reasons it attracts backlinks:
- Uniqueness: Exclusive numbers or trends become canonical references for your niche.
- Authority & E‑A‑T: High-quality data signals expertise and trust, which supports search visibility and brand perception.
- Evergreen value: If the topic is fundamental (e.g., “average conversion rate in X industry”), it keeps earning links whenever others cover that theme.
Best Practice 1:
Find a Trending Topic
Choosing the right topic is the most important strategic decision; great methodology cannot save a boring question. The sweet spot is a question that your audience deeply cares about, that publishers constantly discuss, but for which current data is incomplete, outdated, or contradictory.
Ways to identify strong research topics:
- Analyze search demand: Use keyword tools to spot rising queries and content gaps around “statistics,” “trend,” “benchmark,” or “report” keywords.
- Monitor industry chatter: Track social media, communities, and newsletters to see repeated pain points and unanswered questions.
- Study existing reports: Look for angles others missed (different segments, regions, timeframes, or channels).
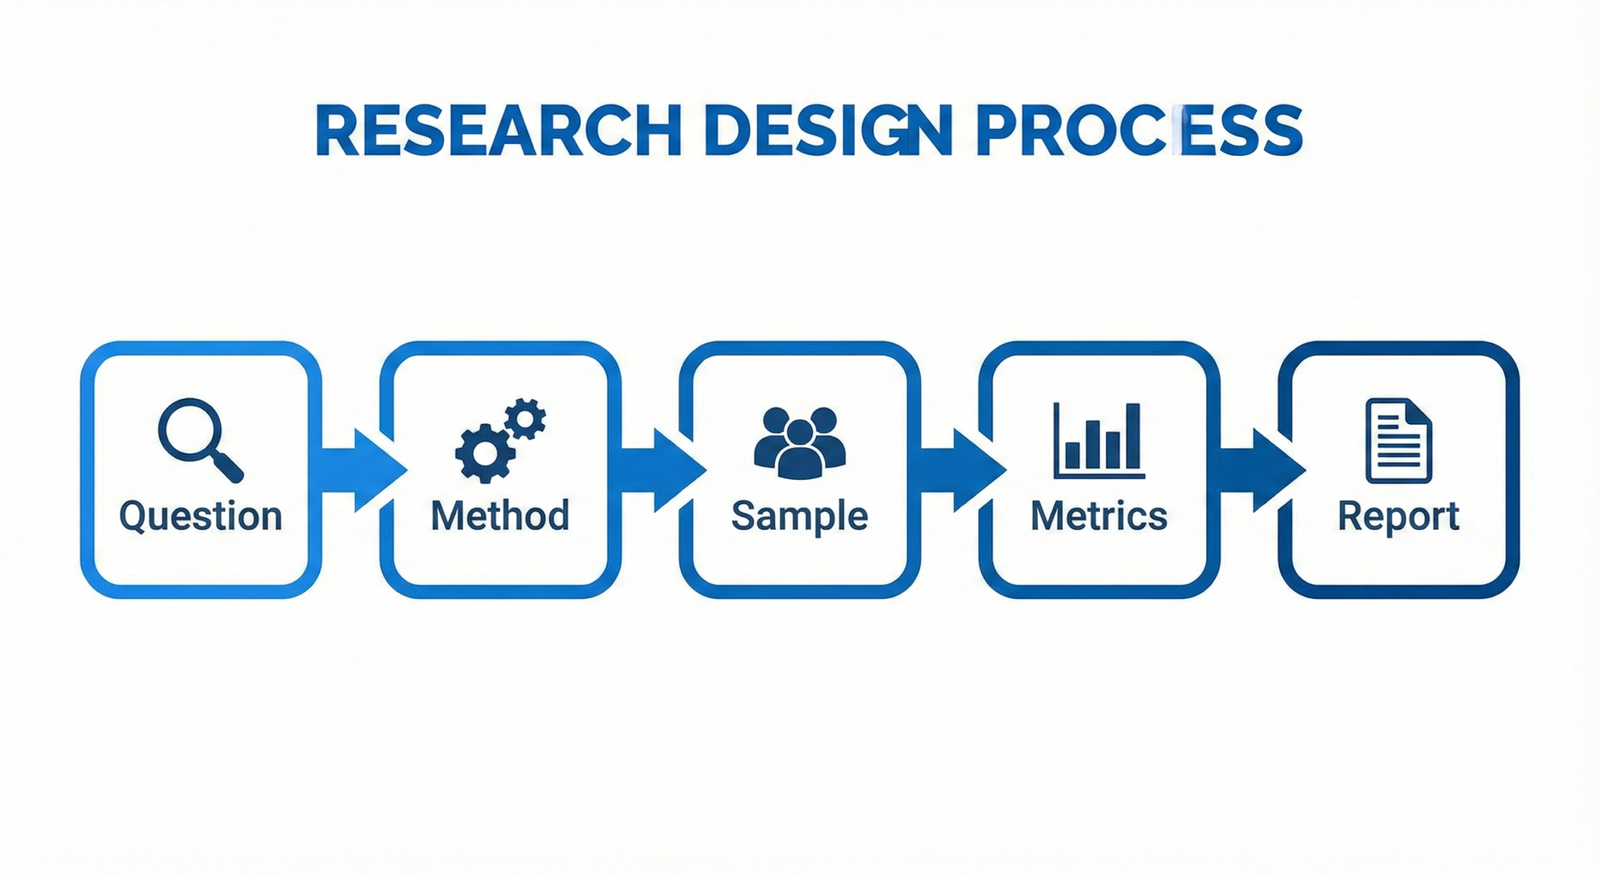
Design Research That’s Link-Worthy
Before collecting data, decide what would make your results genuinely citation-friendly. Often, that means focusing on clear, memorable numbers that answer specific “how many,” “how often,” or “how effective” questions.
Practical design tips:
- Use simple, survey-style questions or clean experimental variables so results are easy to interpret.
- Target sample sizes that are credible for your niche; “N=500 marketers” sounds more reliable than “N=12 respondents.”
- Capture useful segments (by industry, company size, or channel) so others can quote your numbers in multiple ways.
Go Big With the Flagship Report
For your main asset, treat your research like a product launch, not just “another blog post.” A robust flagship report gives people something substantial to save, share, and reference year after year.
How to “go big”:
- Package as a full report: 2,000–5,000 words, with sections, charts, and clear key findings rather than a thin summary.
- Give it a strong, specific title like “2025 SaaS Pricing Benchmark Report” so it’s easily recognized and searched.
- Create a simple landing page with on-page navigation, lead capture, and a downloadable PDF version.
Publish as a Blog Post
Even if you gate a full PDF, always publish the core findings as a public blog post. Public access is what allows journalists, bloggers, and AI-search systems to discover, quote, and link to your data.
Key publishing tactics:
- Put the headline stat and main takeaway above the fold with a strong introductory chart.
- Use descriptive subheadings that match real queries (e.g., “Average Email Open Rate by Industry in 2025”).
- Add schema markup (Article/Report) and internal links to related guides, so the research strengthens your wider content ecosystem.
Report Bite-Sized Stats
While the flagship story matters, links often come from individual, snackable statistics. These bite-sized numbers are what make it into slides, list posts, media quotes, and social threads.
How to create quotable stats:
- Turn each finding into a single, self-contained sentence like “62% of B2B buyers now prefer self-service demos.”
- Pull out “extremes” and contrasts (highest vs lowest, before vs after, region vs region) that tell a clear story.
- Group related stats into mini-sections (e.g., “Channel Performance,” “Budget Trends,” “Tool Adoption”) for easy scanning.
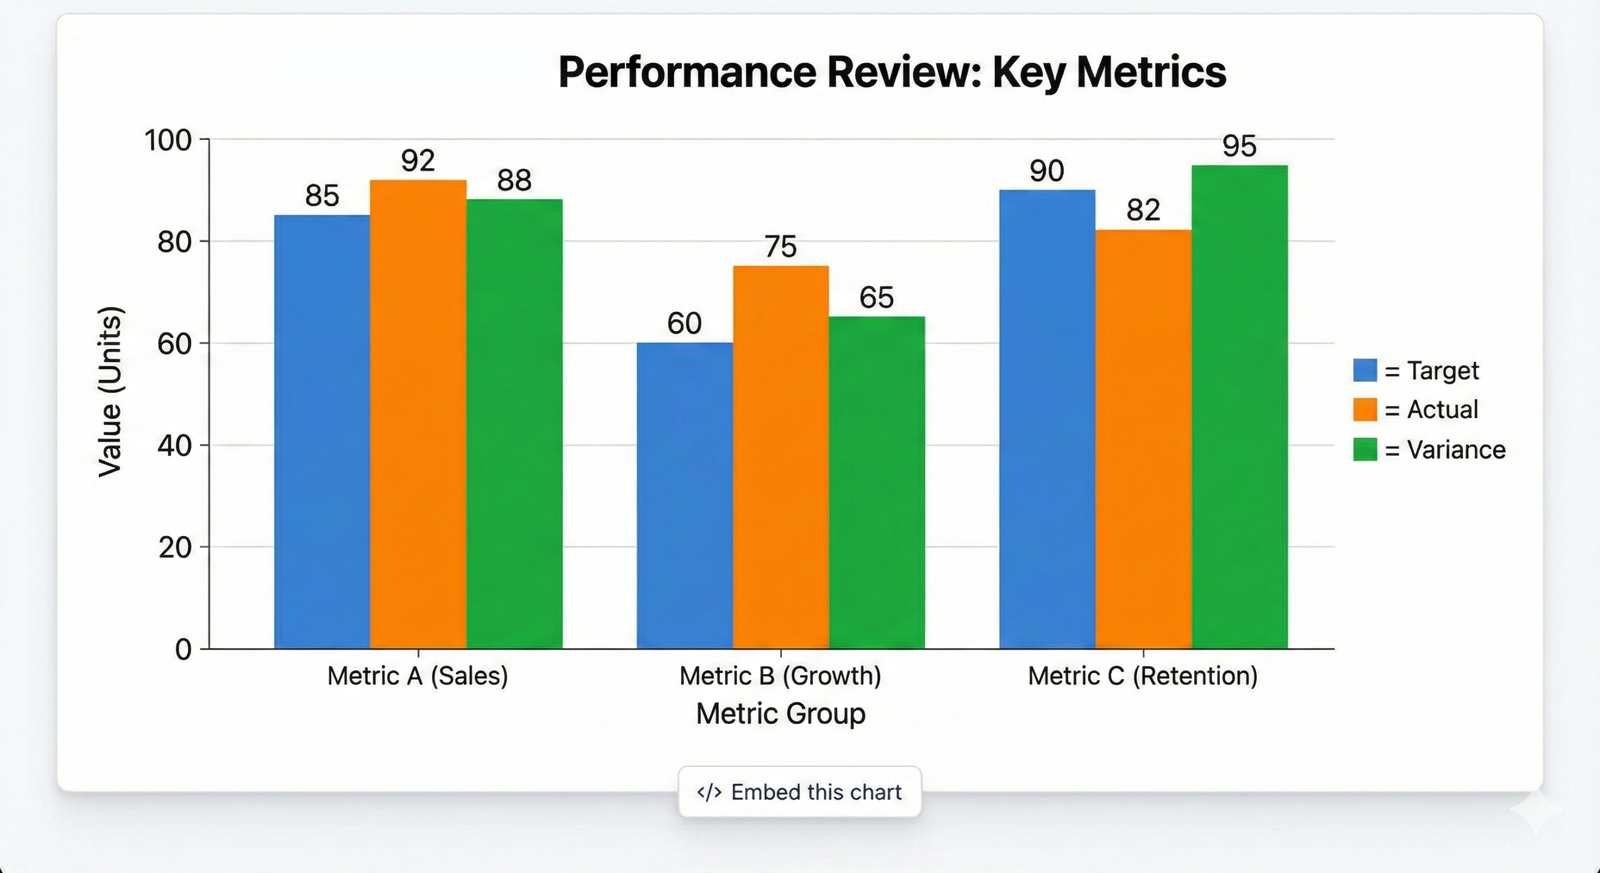
Provide Embeddable Visuals
Visuals dramatically increase shares and links, especially when they help others explain your data quickly. Data-driven visuals like charts and graphs get significantly more trackbacks than posts with generic images alone.
Visual best practices:
- Create clean charts (bar, line, pie) for every major finding, with clear labels and no clutter.
- Offer embeddable versions: export as image files and host them on your blog, then add a simple “Copy embed code” snippet underneath.
- Create a one-page infographic or slide deck summarizing the top insights for presentations and social.
Use Images in Every Section
Research content can feel dense, so visuals are essential for keeping people engaged and improving comprehension. Posts that use multiple visuals—charts, screenshots, infographics—tend to see better time-on-page and more shares.
Ways to add visuals throughout:
- Hero image at the top and at least one chart or illustration in every major section.
- Quote images highlighting surprising stats or expert commentary (great for social repurposing).
- Screenshots of tools, methodologies, or survey forms to make your process transparent.
Promote and Outreach
Publishing is only half the work; to unlock link potential, systematic promotion is crucial. Outreach works especially well when your research directly supports the angles reporters and bloggers already cover.
High-impact promotion steps:
- Notify participants and partners first, giving them ready-made social copy and visuals to use.
- Pitch key findings to relevant journalists, newsletter writers, podcasters, and niche bloggers.
- Repurpose results into guest posts, webinars, and conference talks, always referencing the original report URL.
Image idea: Simple pipeline illustration: “Research → Publish → Outreach → Links & Shares.”
Learn More
Original research becomes most powerful when repeated over time so you can show trends year-on-year. Brands that release annual or recurring studies often become the de facto reference point for their industries.
To go deeper:
- Plan at least one flagship research project each year, supported by smaller pulse surveys or experiments.
- Document your methodology and templates so future projects are easier and more consistent.
- Study leading data-driven content marketers and their reports to refine your own approach.
If you share your niche and audience, a tailored outline can be created for your first original research project (including specific stat ideas and visual formats) based on these best practices.